Reading Cap Rates in a Stubborn Rate Environment

The South Florida commercial real estate market entered 2026 carrying the weight of a two-year standoff. Sellers priced their assets at 2021 and 2022 peak valuations. Buyers underwrote those same assets at current debt costs, which are substantially higher. The gap between those two positions froze deal volume in most segments while the parties waited for the other side to move. In Q1 2026, deal volume in South Florida’s multifamily market was down 26% from the prior year, reflecting this ongoing standoff rather than a collapse in property fundamentals.
Cap rates, the ratio of a property’s net operating income to its purchase price, are the central number in this conversation. When a buyer pays $10 million for a property generating $500,000 in annual net operating income, the cap rate is 5.0%. When interest rates rise, buyers need higher cap rates to make the debt service work. When sellers won’t lower prices to produce those higher cap rates, deals don’t close.
Understanding where South Florida cap rates actually sit by asset class and submarket, and what drives the spread between segments, gives investors a clearer picture of where the market is today and which segments offer better risk-adjusted entry points. This guide covers multifamily, industrial, and retail across Miami-Dade and Broward, with specific numbers by class and location where data is available.
What Cap Rate Measures and What It Doesn’t

A capitalization rate measures the current income yield of a real estate asset assuming an all-cash purchase, with no debt. It is calculated as net operating income divided by purchase price, or alternatively as net operating income divided by current market value when analyzing an existing holding.
Cap rate is useful because it allows quick comparison across properties regardless of how they are financed. A 5.5% cap rate on a Miami multifamily property tells you that, before debt service, the asset generates 5.5 cents of net operating income for every dollar of value. A 7.0% cap rate on a Homestead workforce housing property tells you the same thing at a different rate. The comparison is clean and direct.
What cap rate doesn’t measure is equally important. It doesn’t reflect financing costs, which are currently material. It doesn’t capture appreciation potential, the likelihood that rents or values grow over your hold period. It doesn’t account for capital expenditure requirements, deferred maintenance, or lease rollover risk. And it is backward-looking: cap rate is calculated on current or trailing net operating income, not on projected income. A stabilized property with below-market rents may show a misleadingly low cap rate that improves sharply as leases roll to market rates.
The Federal Reserve’s FRED database tracks the interest rate environment that makes cap rate spreads legible. When 30-year fixed mortgage rates sit above 7%, a 5.0% cap rate produces negative leverage on most conventional debt structures. Investors who entered the South Florida market in 2019 at 5.5% caps with sub-4% debt enjoyed substantial positive leverage. The same cap rate today, with debt priced above 7%, looks very different from an underwriting perspective.
South Florida Multifamily Cap Rates by Submarket
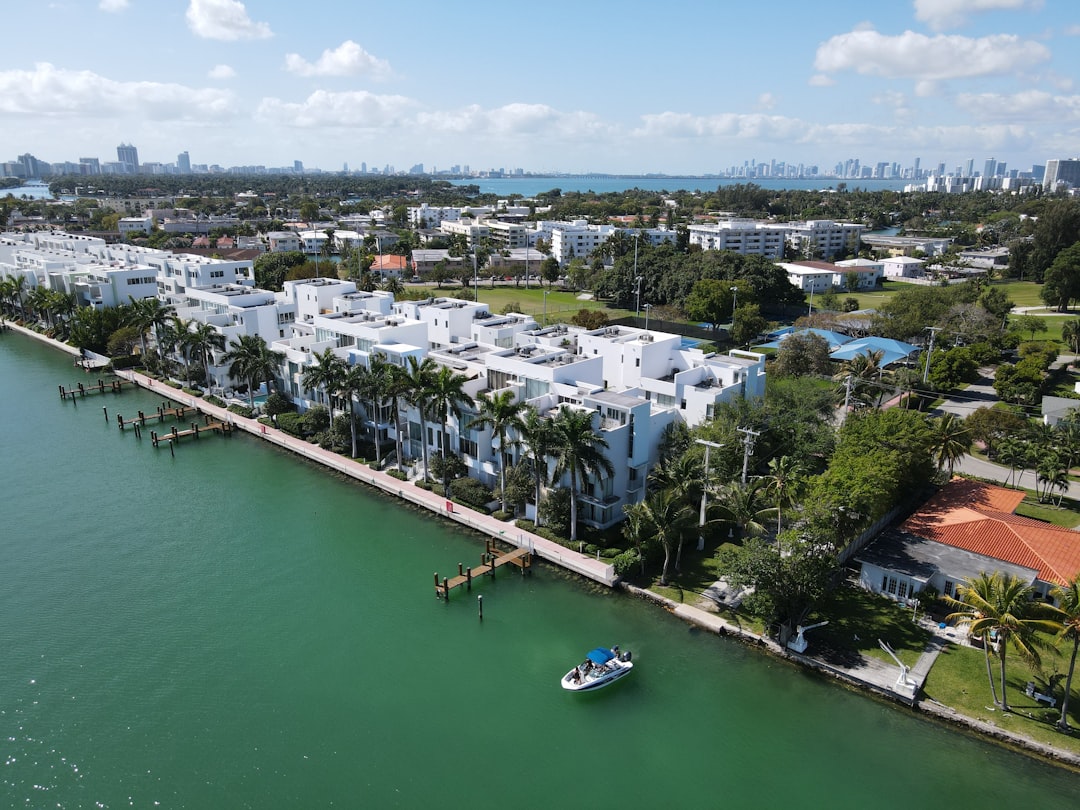
Multifamily remains the most sought-after asset class in South Florida, supported by population growth, a persistent housing supply deficit, and Florida’s favorable tax treatment for residents. Cap rates vary substantially by location and asset class:
- Class A, Brickell / Downtown Miami / Coconut Grove: 4.0% to 4.5%. Core urban assets with strong rent growth history and institutional-grade ownership. Achieving positive leverage at these rates requires significant equity or bridge structures.
- Class A, Aventura / Coral Gables / Fort Lauderdale core: 4.5% to 5.0%. Strong submarket fundamentals with slightly better cap rate spreads than Miami’s urban core.
- Class B, Miami suburban / Broward County: 5.0% to 5.5%. The county-wide average for stabilized Miami-Dade multifamily assets sits at approximately 5.5%, according to market data compiled in Q1 2026. This range is where most value-add acquisition activity occurs.
- Class B, West Palm Beach / Delray Beach / Boca Raton: 5.0% to 5.75%. Palm Beach County multifamily has seen consistent demand as residents relocate from Miami-Dade in search of lower costs while remaining in South Florida.
- Class C, Homestead / South Dade / peripheral markets: 6.5% to 7.5%. Higher yields reflect workforce housing characteristics, older stock, and higher management intensity. Value-add potential is real but requires active operational capacity.
Multifamily deal volume in South Florida totaled nearly $750 million in Q1 2026, down 26% from Q1 2025. The drop reflects bid-ask spread and elevated debt costs, not deteriorating fundamentals. Occupancy remains strong across all classes, and rent growth, while slower than the 2021 to 2022 peak, remains positive in most submarkets.
Industrial Cap Rates in Miami-Dade and Broward
Industrial is the strongest-performing segment in South Florida by deal volume as of early 2026. Q1 industrial investment sales reached $824.4 million, up 14% from Q1 2025 and 34% above the Q1 average from 2017. The asset class has attracted institutional capital, logistics operators, and private investors who recognize that South Florida’s port-adjacent industrial inventory is structurally constrained by geography: there is simply no more land to build on in the core infill markets.
Cap rates in South Florida industrial currently range from approximately 5.0% to 5.3% for prime Miami-Dade assets, particularly those near Miami International Airport, PortMiami, and the airport industrial corridor. Broward County industrial, with its access to Port Everglades and Fort Lauderdale-Hollywood International Airport, trades in a similar range. Outer markets in western Miami-Dade and parts of Palm Beach County range from 5.5% to 6.5% depending on vintage, clear height, and dock configuration.
The demand drivers supporting industrial are durable. South Florida’s role as a gateway to Latin American trade generates persistent demand for warehouse, distribution, and cross-docking facilities. E-commerce last-mile delivery requirements create demand for smaller, infill industrial product closer to the densely populated coastal markets. Cold storage demand, driven by South Florida’s food service and pharmaceutical sectors, commands premium rents and generally trades at the tighter end of the cap rate range.
For investors accustomed to the cap rate environment of 2019 and 2020, South Florida industrial yields look modest. For investors focused on supply constraint, long-term rent growth potential, and the inflation-hedging characteristics of real assets, the segment continues to attract capital even at current yield levels.
The Debt Math That Determines Deal Flow

Cap rate in isolation doesn’t determine whether a deal works. The spread between cap rate and the cost of debt determines whether an acquisition generates positive or negative leverage, and that spread has compressed severely since 2022.
In 2020 and 2021, a South Florida multifamily property purchased at a 5.5% cap rate with 65% leverage at a 3.5% interest rate generated meaningful positive leverage. The unlevered yield exceeded the cost of debt by 200 basis points, and equity returns were amplified by that spread. In 2026, the same property type purchased at a 5.5% cap rate carries debt priced at 300 to 350 basis points over Treasuries, producing all-in rates in the 7.0% to 7.5% range depending on debt type and term. The unlevered yield now sits below the cost of debt. Leverage hurts returns rather than helping them.
Florida multifamily and industrial financing in 2026 typically requires 60% to 65% loan-to-value with minimum debt service coverage ratios of 1.25x and minimum debt yields of 9% to 10%, according to lender term sheets circulating in Q1 2026. These constraints limit how much debt many acquisitions can support at current pricing. Buyers who can bring all-equity or high-equity structures have a genuine advantage in the current environment: they aren’t constrained by the negative leverage math, and they can write cleaner offers that close more reliably.
Research from Florida Realtors tracking commercial market conditions consistently shows that South Florida’s commercial fundamentals, particularly in multifamily and industrial, remain strong despite the financing constraints. The standoff in deal volume reflects financing market conditions, not a deterioration in property-level performance.
Cap Rate Compression in South Florida: Why It Happened

South Florida commercial cap rates compressed significantly between 2015 and 2022, driven by capital inflows, population growth, and historically low interest rates. Understanding that compression history helps investors contextualize where rates sit today and why sellers’ pricing expectations haven’t fully adjusted to the current financing environment.
Industrial cap rates in prime South Florida markets compressed from approximately 7.5% in 2015 to 4.5% to 5.0% by late 2021, a compression of 250 to 300 basis points in six years. Multifamily Class A in Miami’s urban core compressed from 5.5% to 6.0% in 2015 to 3.5% to 4.0% at the 2021 peak. Those peak valuations were supported by a financing environment where ten-year Treasuries sat below 2% and debt was priced accordingly.
Sellers who bought at 2021 prices and financed with short-term floating-rate debt now face refinancing risk as those loans mature. The properties haven’t declined in income, in many cases rents are higher than at acquisition, but the refinancing math at current rates doesn’t work at 2021 purchase prices. This dynamic is creating the first wave of distressed opportunity in the South Florida commercial market since 2011 to 2013. It is selective, concentrated in specific asset types and capital structures, and is unfolding slowly as loan maturities extend and lenders extend forbearance. But it is real.
For investors with patient capital and clear acquisition criteria, the 2026 South Florida commercial market offers better entry points than 2019 to 2021 across most segments, even at current cap rates, because the outlook for rent growth over a five-year hold is supported by supply constraints that haven’t changed.
Using Cap Rate in Your Acquisition Framework

Cap rate is one input in an investment analysis, not the conclusion. Using it effectively means understanding what it tells you and building the surrounding underwriting around what it doesn’t.
For acquisition underwriting, pair cap rate with the following:
- Going-in versus stabilized cap rate: A value-add property may show a 4.5% going-in cap rate on current below-market rents, but a 6.5% stabilized cap rate once units are renovated and leased at market. Underwrite the stabilized rate and build a realistic timeline to get there.
- Exit cap rate assumption: Model your exit at a higher cap rate than your entry. If you bought at 5.5% and underwrite your exit at 5.5% five years from now, you are assuming no cap rate expansion over the hold period. A more conservative and defensible exit assumption is 25 to 50 basis points above your entry, particularly in a period of rate uncertainty.
- Rent growth rate: South Florida multifamily rent growth has averaged 3% to 5% annually over a ten-year period in most submarkets. Underwriting above that historical range requires a specific thesis about why the submarket will outperform.
- Capital expenditure budget: A 5.5% cap rate on a property that needs a new roof, new HVAC systems, and updated common areas is effectively a lower yield once those costs are funded. Budget capex separately from the acquisition price and run returns both ways.
The IRS depreciation rules for commercial real estate, which allow owners to deduct the cost of a building over 39 years under standard depreciation, provide meaningful tax benefits that don’t appear in the cap rate. For taxable investors, the combination of current income yield and depreciation-sheltered cash flow is a significant part of the commercial real estate return stack.
Working with the Right Brokerage on Commercial Acquisitions
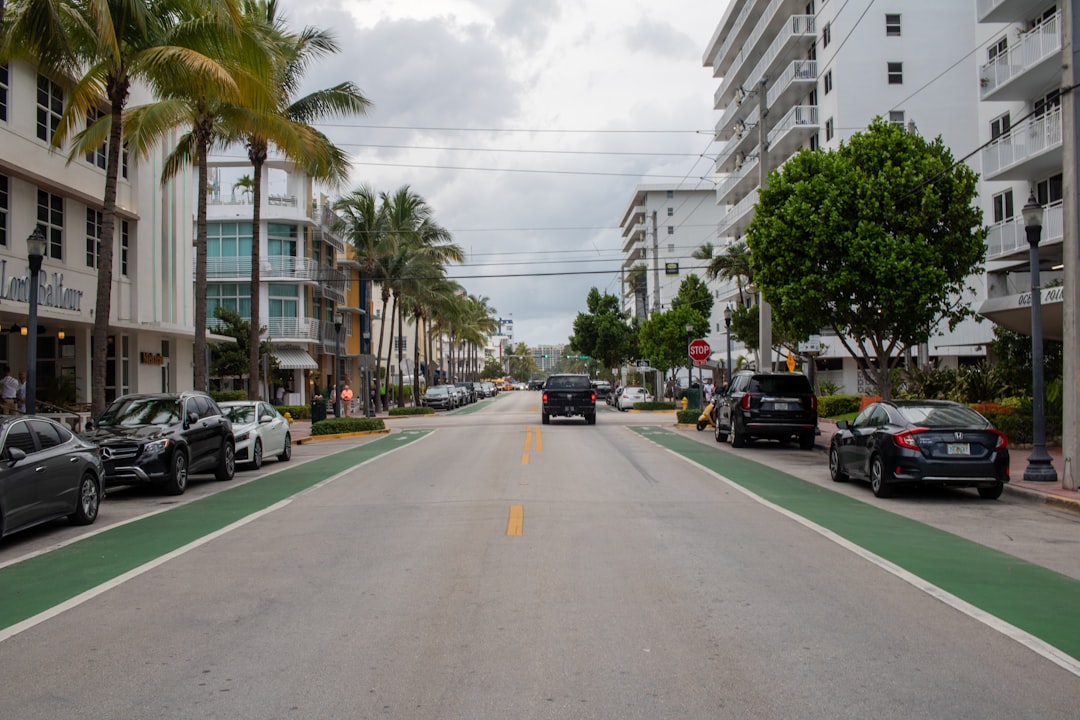
South Florida’s commercial real estate market rewards relationships and local knowledge at every phase of an acquisition, from sourcing deals that haven’t publicly listed to navigating the due diligence complexity of a building with multiple tenants, deferred maintenance, and below-market leases. The broker you work with needs active market presence, not just database access.
At MJI Realty Group, we work with investors on both residential luxury and commercial acquisitions across South Florida’s markets. Our approach is direct: we tell buyers what a market actually looks like, what properties are achievable at their target yield and price point, and where the risk sits in any specific deal. We don’t pad returns or soften the debt math to make a deal look better than it is.
If you are evaluating a South Florida commercial acquisition and want a frank conversation about where cap rates are, what properties are available in your criteria, and how the current financing environment affects your target returns, get in touch.
Real estate decisions depend on individual circumstances. This article provides general information about South Florida commercial real estate market conditions and is not legal, tax, or investment advice for your specific situation. Consult qualified legal counsel, a CPA, and a licensed financial advisor before making any commercial real estate investment decision.